Logs & Config
Visual guide to managing incoming and outgoing webhook configurations and logs.
How to Access the Logs & Config Interface
Before you can manage your webhook settings, you need to navigate to the Logs & Config Interface dashboard.
Step 1: Log in
Log in to your account to view your main dashboard.
Step 2: Open the Settings Menu
Look at the main menu on the left side of your screen. Find and click the Settings icon (the gear icon) to open the Settings popout menu.
Step 3: Open the Webhook Dashboard
Click on Webhook from the menu to open the dashboard.
How to View Webhook Subscriptions
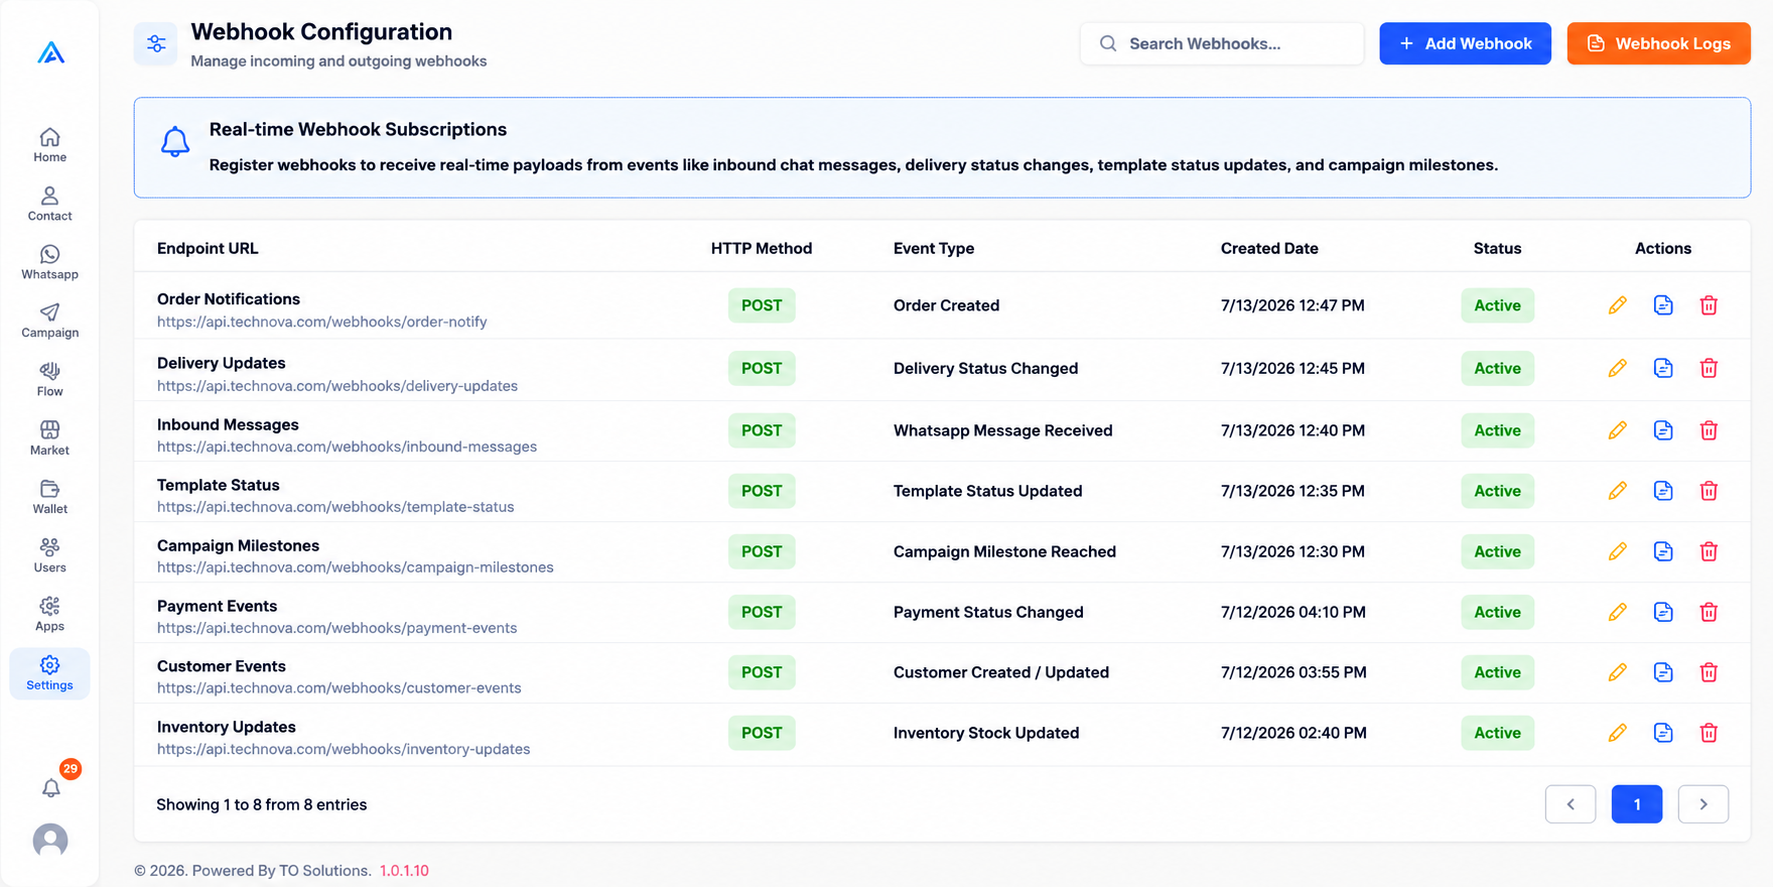
This screen lists all your webhook subscriptions. You can manage incoming and outgoing webhooks to receive real-time payloads.
Step 1: Open the Dashboard
Review the main table which lists your Endpoint URLs, HTTP Methods, and subscribed Event Types.
Step 2: Review Active Endpoints
Check the status column to see which webhooks are currently active. You can edit, copy, or delete them using the action icons.
How to Create a Webhook
When adding a new webhook, you can define a Friendly Name, Endpoint URL, HTTP Method (e.g. POST), and the Event Type to subscribe to. You can also configure custom payload bodies and headers.
Step 1: Open the Creation Form
Click the blue + Add Webhook button located in the top right corner of the dashboard.
Step 2: Fill in General Details
Provide a Friendly Name, your Endpoint URL, select an HTTP Method, and choose the specific Event Type from the dropdown.
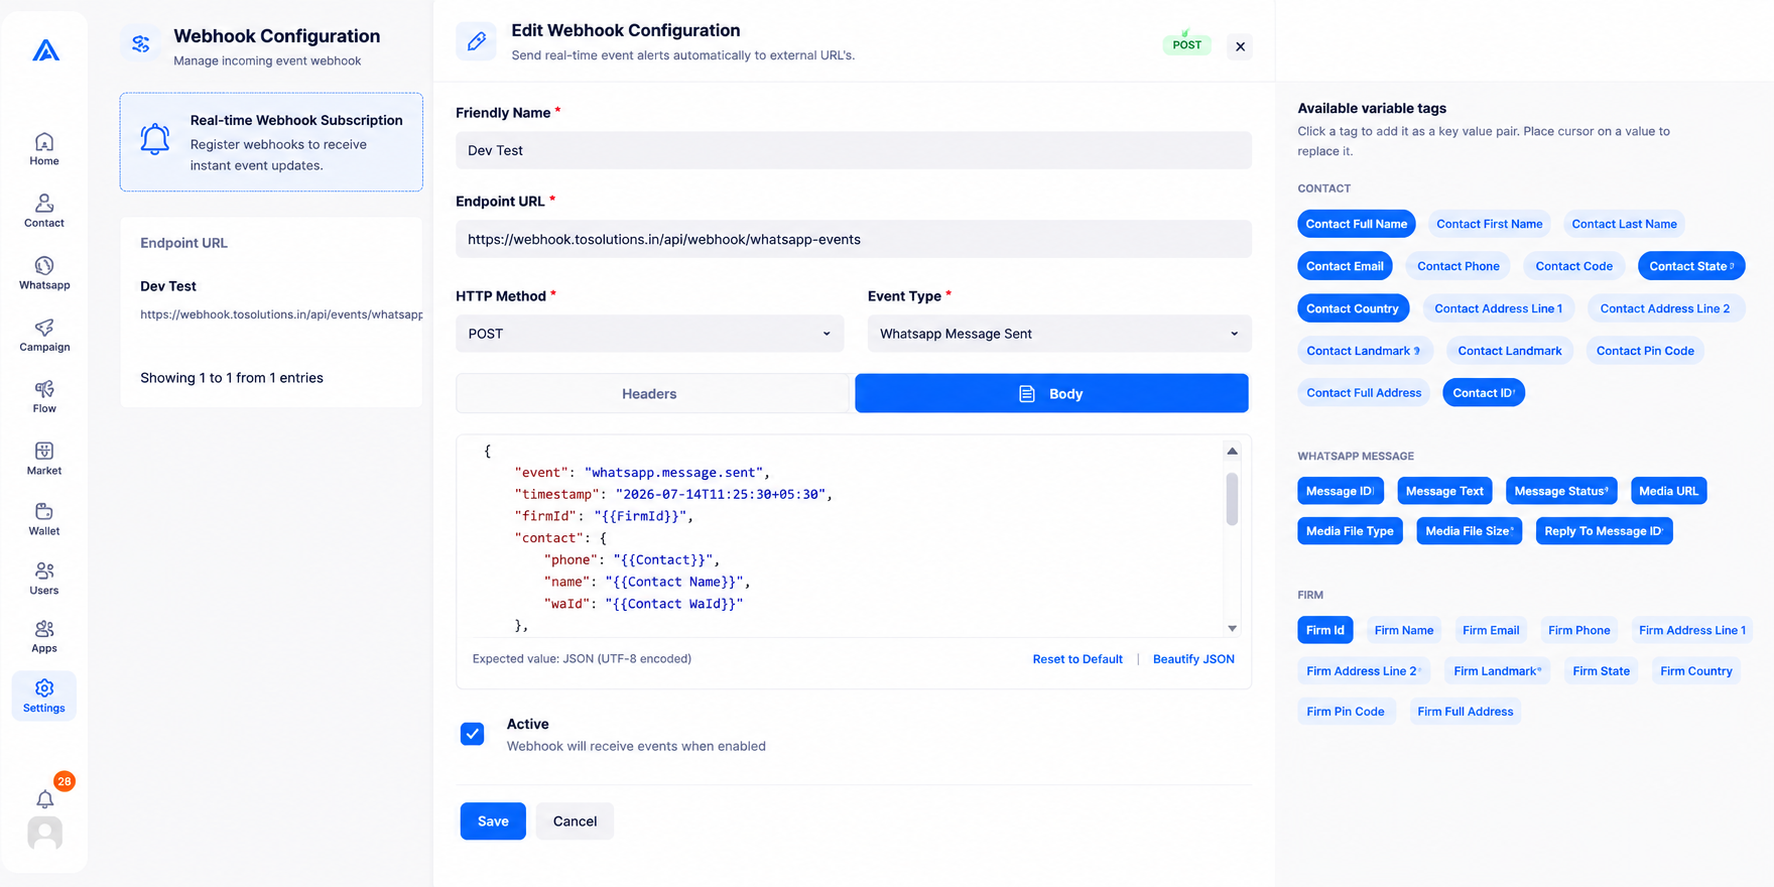
Step 3: Configure Body Payload
Switch to the Body tab. Here you can write your JSON payload. You can click on the Available variable tags on the right sidebar to dynamically insert data fields (like Contact Full Name, Message ID, or Firm ID) into your JSON.
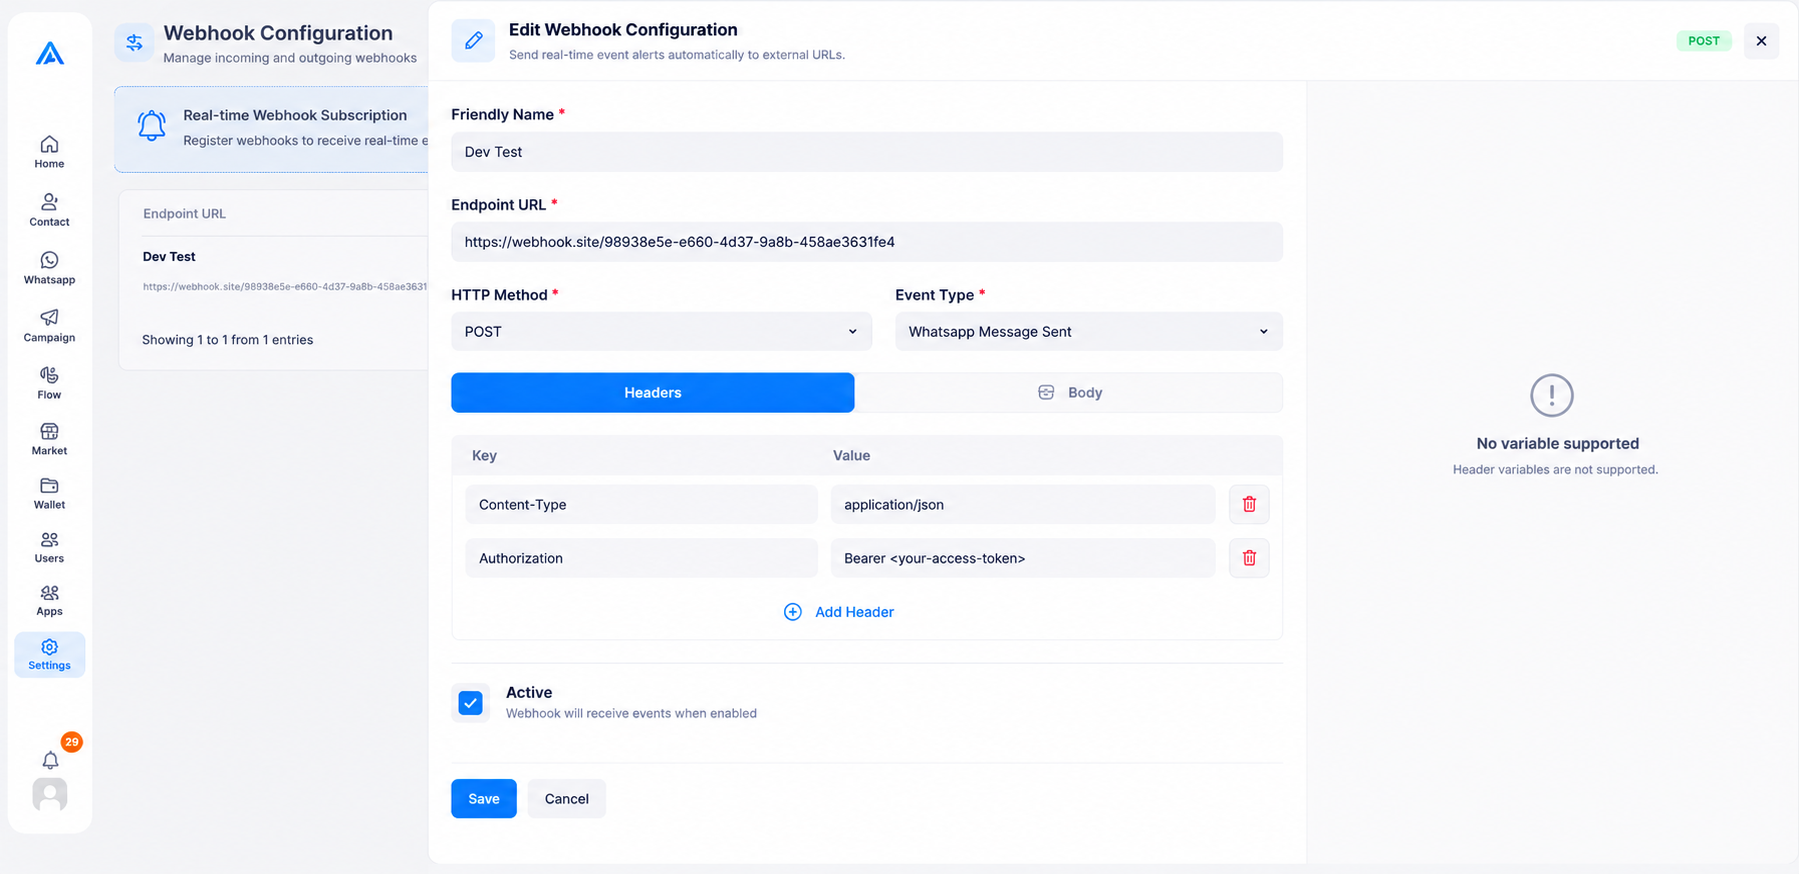
Step 4: Configure Headers
Switch to the Headers tab to add custom Key-Value pair headers (e.g., for Authorization tokens). Note: Variable tags are not supported inside headers.
Step 5: Save Webhook
Make sure the Active checkbox is ticked, then click Save at the bottom to register the webhook.
How to View Delivery Logs
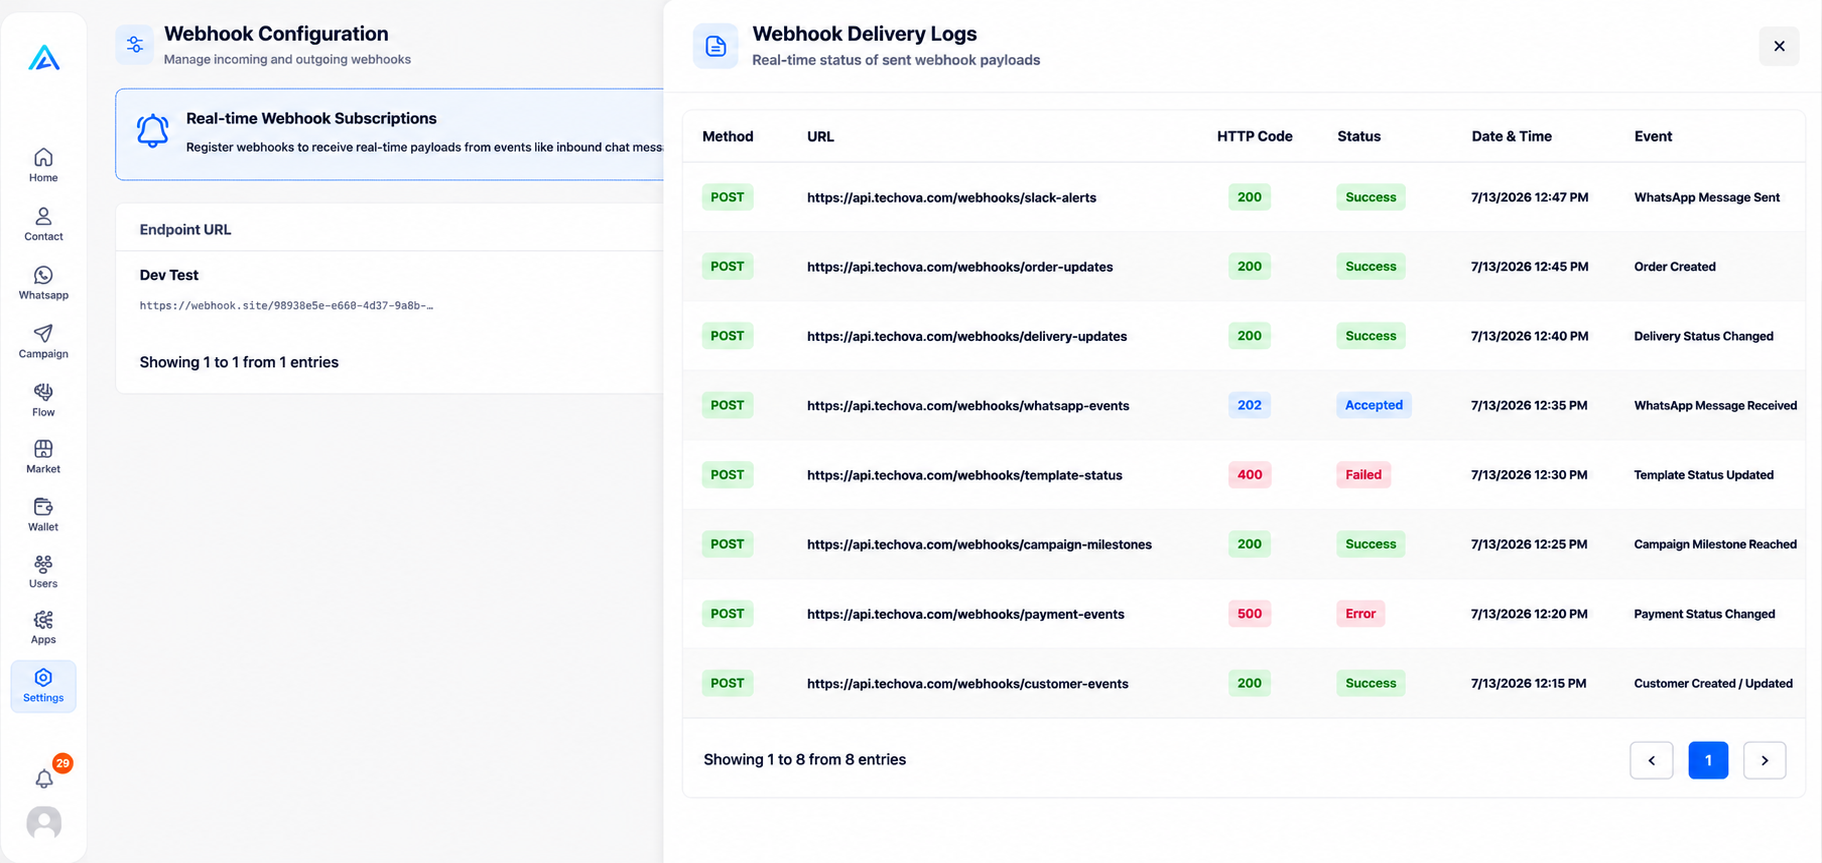
Access real-time status logs of sent webhook payloads to verify delivery and troubleshoot failed requests.
Step 1: Open Webhook Logs
Click the orange Webhook Logs button located at the top right of the dashboard, next to the Add Webhook button.
Step 2: Inspect Payload and Status
Review the HTTP response codes (like 200 OK or 404 Not Found) to ensure your payloads are reaching their destination.