Key Manager
Visual guide to managing and generating API keys.
How to Access the Key Manager Interface
Before you can manage your API keys, you need to navigate to the Key Manager Interface dashboard.
Step 1: Log in
Log in to your account to view your main dashboard.
Step 2: Open the Settings Menu
Look at the main menu on the left side of your screen. Find and click the Settings icon (the gear icon) to open the Settings popout menu.
Step 3: Open the API Keys Dashboard
Click on Api Key from the menu to open the API Keys dashboard.
How to View the API Keys Dashboard
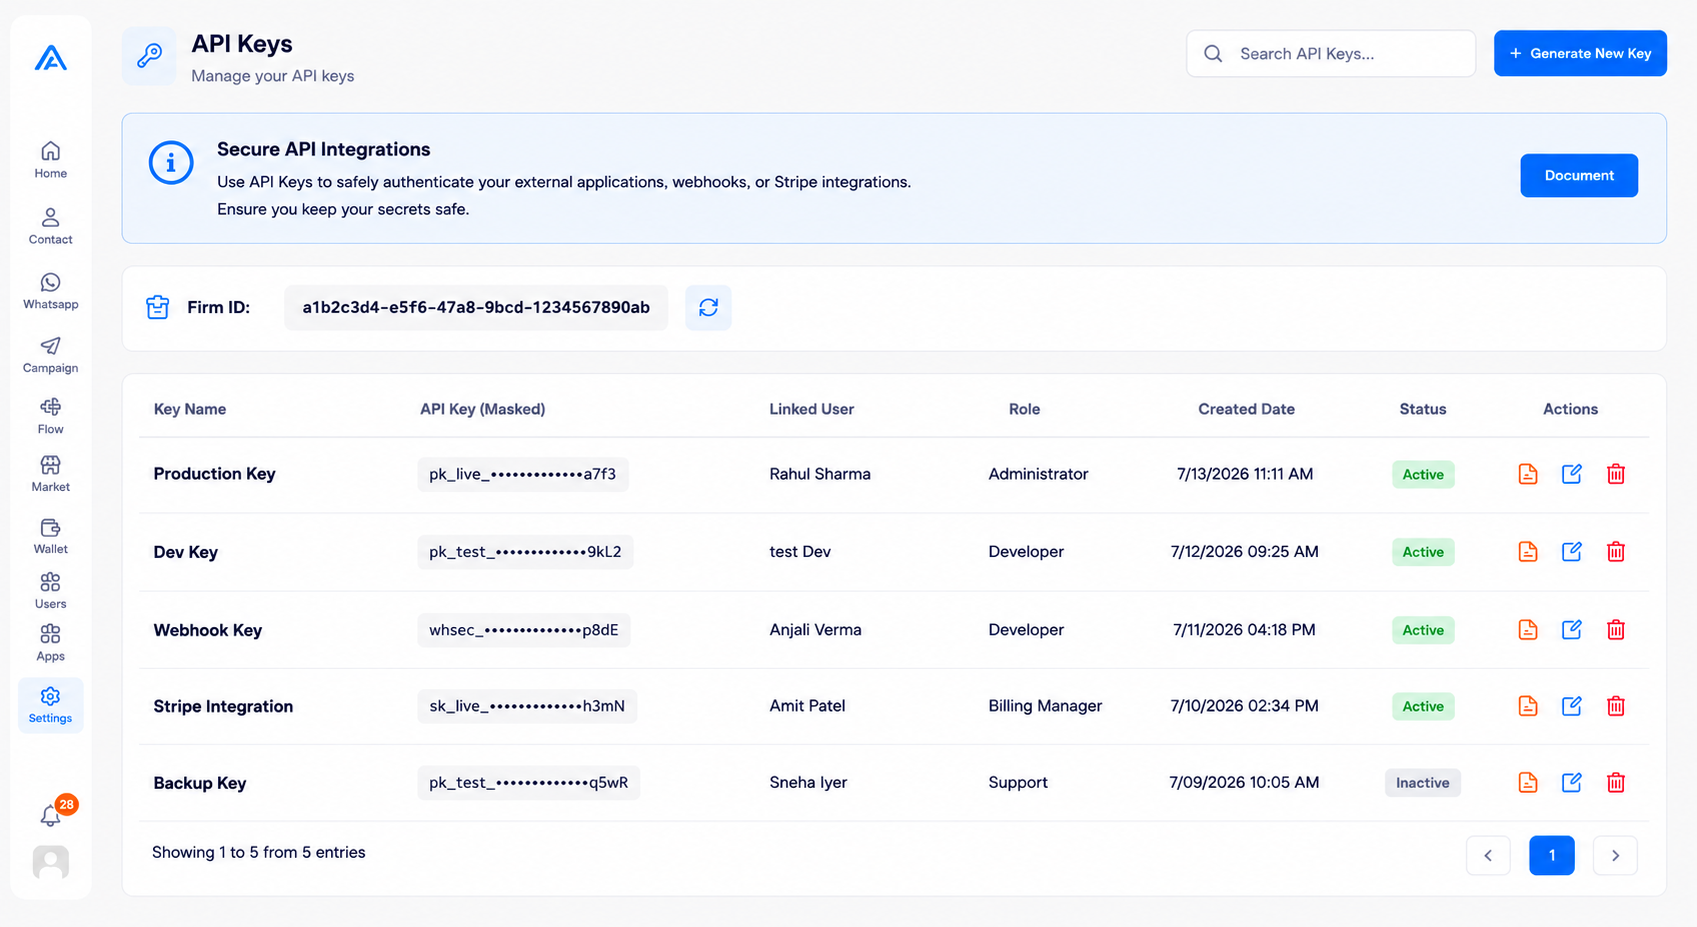
The main screen lists all your generated API keys. You can view your firm ID and see details for all existing keys.
Step 1: View Firm ID
Your unique Firm ID is displayed at the top. You can click the copy icon next to it to use it for external integrations.
Step 2: Review API Keys
The main table lists your active API keys. Note that the keys are masked for security. From here, you can see their status, linked users, and use the action buttons to manage them.
How to Generate an API Key
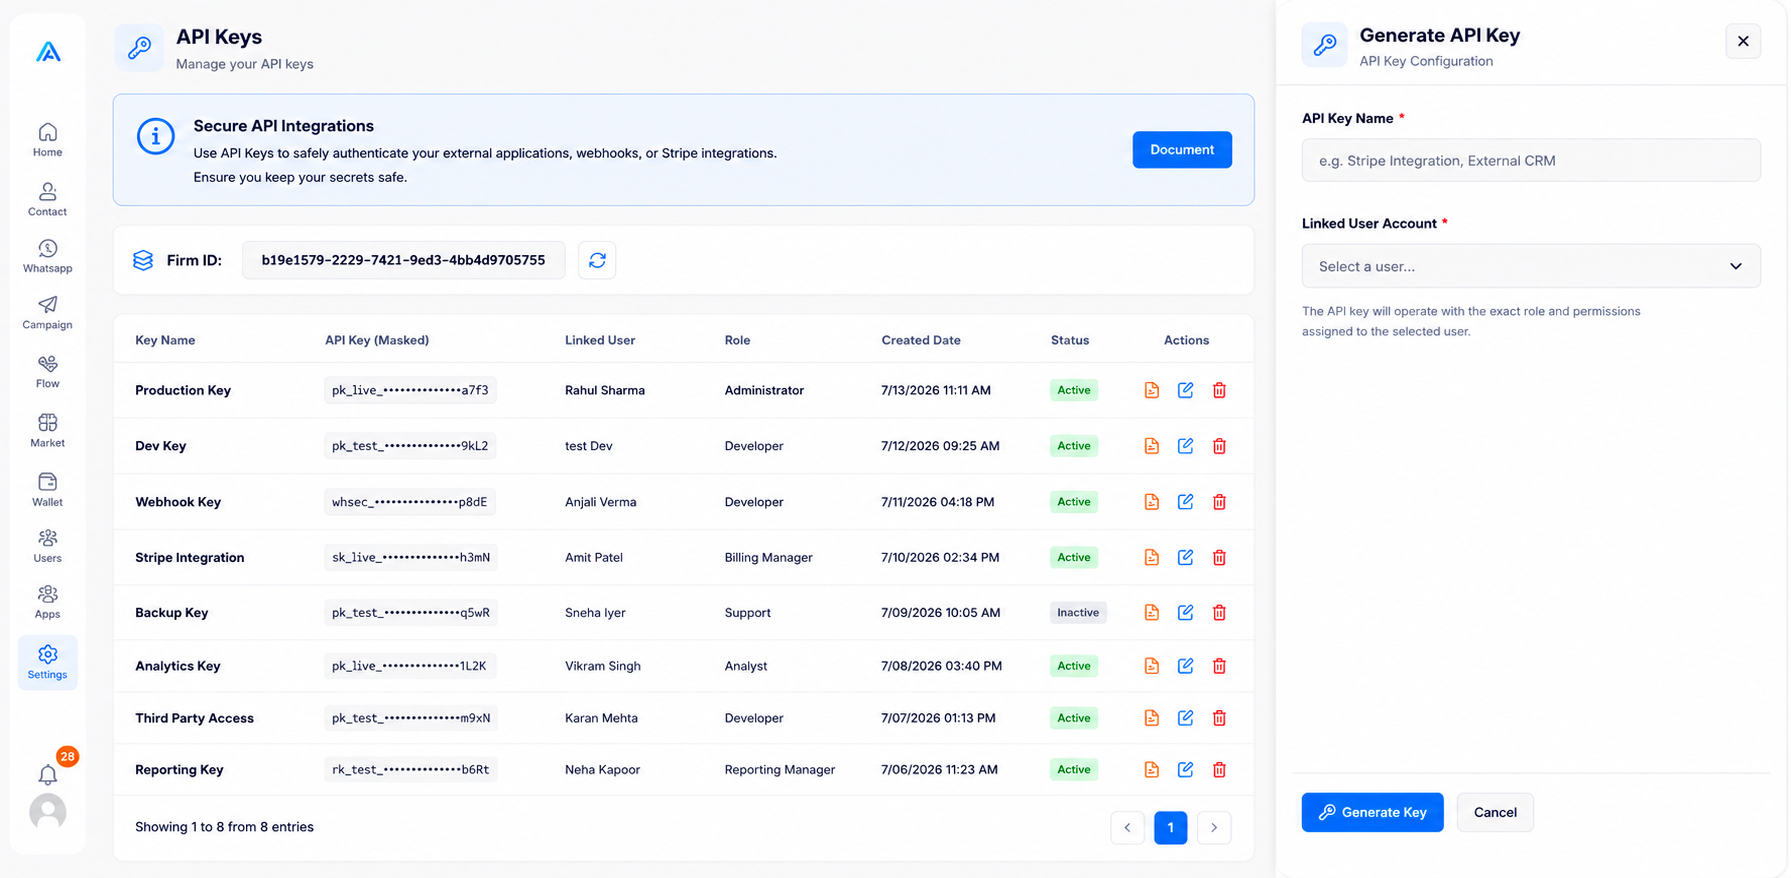
When creating a new API key, you will be prompted to provide a name and link it to a specific user account. The API key will operate with the exact role and permissions assigned to the selected user.
Step 1: Open the Generation Form
Click the blue Generate Key button located in the top right corner of the dashboard.
Step 2: Fill in Details
Provide a Key Name and select a Linked User Account from the dropdown. Then click Generate Key.
How to View API Key Usage Reports
Monitor the performance and activity of your API keys through detailed usage reports.
Step 1: Open the Usage Report Panel
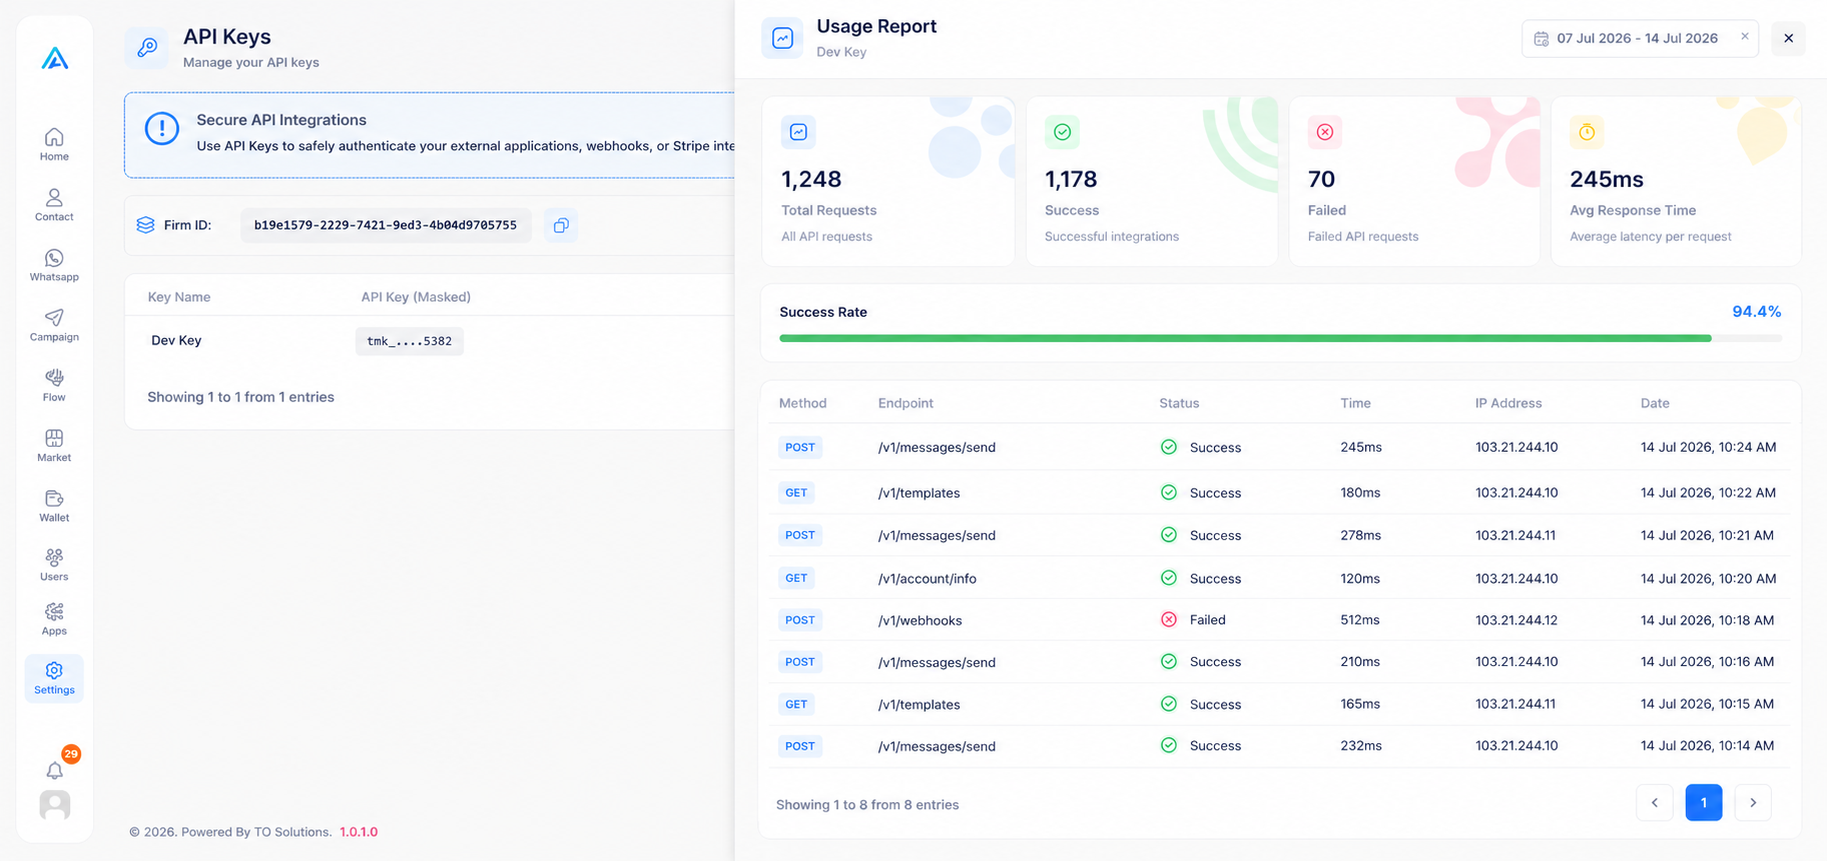
In the API Keys table, look for the Actions column on the far right. Click on the first icon (the usage report icon) next to the API key you want to inspect. This will open the side panel.
Step 2: Filter by Date
Use the date picker in the top right of the panel to select a specific date range for your report.
Step 3: Review Metrics and Logs
Review key metrics such as Total Requests, Success and Failure counts, and Average Response Time. Below the summary, you can analyze the Success Rate bar and detailed individual request logs.